High-resolution water-quality monitoring for rivers, lakes, and reservoirs.
My role
Lead Software Engineer, then Head of Software
When
2021–2024
Built with
Python, Flask, FastAPI, neural networks, atmospheric correction, AWS Batch and S3, multi-cloud infrastructure, Sentinel-2 and Planet imagery, hyperspectral IoT sensors
Satellite imagery and water-quality maps in GybeMaps. Animation: Gybe.
The idea
Checking water quality usually meant sending people out to collect samples by hand: slow, costly, and only a few points on a river or reservoir at a time. Satellites can see a whole water body every few days, but most water remote sensing was built for the open ocean, where conditions change gradually across kilometers and ocean-color pixels 300 m to 1 km wide are good enough.
Rivers, lakes, and reservoirs are narrow and change over short distances, so they need far finer detail. GybeMaps monitored them with Sentinel-2 imagery at 10 m and Planet imagery at 3 m, checked against Gybe’s own field sensors, so water managers could see an entire water body at once and spend less time sampling by hand.
I joined as Gybe’s first developer, when GybeMaps was a beta running locally on xcube’s viewer with no cloud pipelines, and later became Head of Software. For three years I built and ran its backend: the processing pipelines, atmospheric correction and machine learning, the APIs, and the infrastructure behind the maps.
In 2024, four hydroelectric dams on the Klamath River were breached in the largest dam removal in history. Gybe’s job was to track what followed: the sediment released from behind the dams, its path downstream, and the river’s recovery from the former reservoirs to the Pacific.
Gybe began monitoring in October 2022, before drawdown, to establish a baseline. Four hyperspectral sensors along 408 km of river, co-located with USGS and Karuk Tribe gauging stations, provided continuous ground truth. Sentinel-2 covered the basin every five days, with an archive back to 2016, and from July 2023 daily Planet imagery sharpened the view from 10 m to 3 m.
I built and maintained the platform that ingested and transformed this data and served the maps. Sensor readings and satellite imagery were combined automatically, with water-quality maps updated within 24 hours of each satellite pass.
Monitoring continued through November 2025. It detected turbidity above 1,400 FNU during the removal, followed sediment from the dam sites to the ocean, and showed algal blooms in the former reservoirs collapsing after drawdown. By 2025, turbidity had returned to pre-removal levels.
Satellite coverage
2,377 km²
Imagery collected
1.5 TB
Sensor measurements
55,663
The Klamath River mouth from orbit, with river sediment spreading into the Pacific.
I built GybeMaps’ backend and processing platform and kept it running for three years, through projects for the City of Salem’s drinking water, The Nature Conservancy in the Mississippi basin, AB InBev’s barley growers, and the Klamath dam removal.
Cloud platform
I built Gybe’s cloud infrastructure from scratch across multiple cloud providers, with redundant pipelines that kept every water body’s satellite archive up to date and ran water-quality analysis producing six or more parameters per scene.
Operations
I maintained the backend and processing pipeline day to day: processing jobs for a petabyte-scale satellite archive, monitoring and fixing pipelines, and new API features in Flask and FastAPI.
Satellite processing
Sentinel-2 processing on AWS Batch and S3, and a Planet workflow that delivered water-quality maps within 24 hours of each satellite pass.
Machine learning
I implemented atmospheric correction algorithms, both from published research and ones invented by our staff scientists, and built my own neural networks to predict water-quality parameters from satellite and sensor data.
Product
I partnered with our designer and frontend team on new features, weighing the trade-offs from the data and platform side.
Leadership
As Head of Software, I helped set the roadmap from an enterprise data perspective and led a distributed team across the US and Portugal while remaining the principal backend contributor. I set the team’s technical standards, interviewed candidates, and mentored its engineers.
Where Gybe’s technology was used
Gybe’s projects spanned drinking water, habitat restoration, and agriculture.
City of Salem
Gybe monitored water quality to help protect the drinking-water supply in Salem, Oregon.
The Nature Conservancy
Gybe monitored water quality in Louisiana’s Mississippi River Delta to support ecological habitat restoration.
AB InBev
Gybe monitored irrigation water for barley growers along the Snake River in eastern Idaho.
Each of these projects ran on the platform I built and maintained: the pipelines that processed every satellite pass, the backend and APIs behind the maps, and the jobs that kept each site’s data current.
Gybe’s system included physical instruments as well as satellite processing and software. Its autonomous, above-water sensors measured light at the water surface. Field observations supported the calibration and validation of water-quality estimates alongside satellite data.
My work included bringing sensor data into the platform, and I occasionally took part in field installation and calibration. That connected the software work to the practical conditions under which measurements were collected.
A Gybe sensor installed above the water surface.Field work at Detroit Lake. Photo: Gybe.
For every monitored water body, the pipeline watched for new satellite passes, fetched each scene, clipped it to the water body’s outline, corrected it for the atmosphere, and ran the water-quality algorithms that produced six or more parameters. AWS Batch ran the processing, and S3 held the imagery and results.
Archives reached back to 2016, so besides processing each new pass, the same pipelines ran full archive runs over a site’s history. Across every water body, the collection reached petabyte scale.
New satellite pass
Each Sentinel-2 or Planet overpass produced a new scene for every water body it covered.
Correction and analysis
AWS Batch jobs clipped each scene, corrected it for the atmosphere, and ran the water-quality algorithms.
Maps and API
Results in S3 and the database fed the maps, time series, and API.
Simplified view. Redundant pipelines kept every water body’s archive current while full archive runs worked through past years.
What made the pipeline hard
The pipeline ran continuously for every customer site, which raised a few hard problems.
Large scenes
A scene could be several hundred megabytes or up to a terabyte, depending on the size of the water body. I optimized the water-body shapefiles and other inputs so each job processed less and finished sooner.
Bursts of work
A full archive run could add hundreds of scenes for one site while every other site still needed its regular processing, so the pipeline had to absorb large bursts alongside its daily load.
Redundancy
I built the pipelines redundantly to keep every water body’s satellite archive up to date, even when individual jobs failed.
Inland atmosphere
Narrow rivers and small reservoirs leave little open water to measure, and light scattered from nearby land skews the signal. Atmospheric correction had to suit inland water, so I implemented methods from published research and ones developed by Gybe’s scientists.
Shared state
Workers ran in parallel against shared database state. Table locks decided where processes needed exclusive access and where expensive satellite processing could run side by side.
From observation to a useful answer
The product let users explore a waterbody geographically and over time. Satellite imagery gave a wider view, while sensor measurements added local observations. Maps and charts made changes easier to inspect.
The engineering work sat between those scientific inputs and the interface: ingesting observations, transforming them into useful measurements, and delivering them reliably to the application.
A map and measurements from multiple locations in one dashboard. Image: Gybe.
Maps
Users could explore water-quality information across a waterbody.
Time series
Users could inspect how measurements changed over time.
Combined data
The platform brought satellite and sensor observations into a shared workflow.
Recent measurements in context
The location detail view placed several water-quality parameters side by side. Historical series let users compare recent readings with previous years and see how they fit into a seasonal pattern.
Comparing measurements at Detroit Dam across years. Image: Gybe.
Locations over time
The Explorer connected a location on the map with its measurements over time. Users could choose a data layer, adjust the time window, and compare locations while keeping the geographic context in view.
Mapped locations alongside turbidity and suspended-matter time series. Image: Gybe.
Software, science, and field work
The platform depended on software engineers, water-quality scientists, and field deployment working together. Integrating sensors meant understanding how observations were collected as well as how they would appear in the product.
The Gybe team.
Research and reports
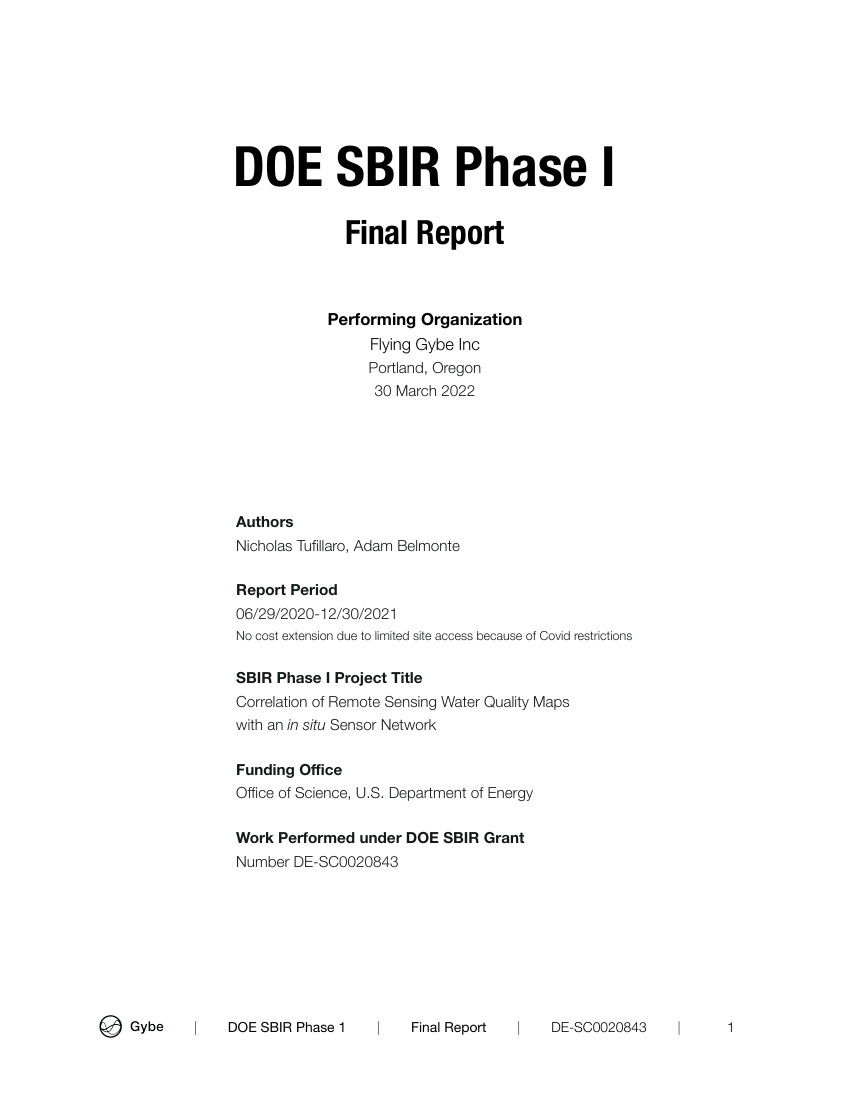
DOE SBIR Phase I · March 2022
Correlation of Remote Sensing Water Quality Maps with an in situ Sensor Network
By Nicholas Tufillaro and Adam Belmonte. A report connecting remote-sensing water-quality maps with field measurements.
I contributed to the preparation of this report and am credited in its acknowledgments.
 Henry Kobin